2013-04-30

A VISIT TO A 17th CENTURY VILLAGE part.2: Homesteads and Outfields


Today we are going to investigate the village of Stjärnholm once again, this time focusing on the homesteads themselves and the information we can find about them in Notarum explication. For more about this village, please read my earlier post!

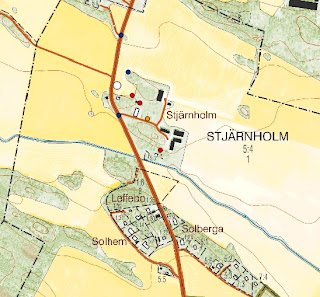
 The village of Stjärnholm, with the homesteads marked


Notarum explicatio

  The first thing usually described on each homestead is the name of the farmer. These names are very common even today, and almost all of them have surnames ending with “-son”. In this particular village we have two farmers (in homestead 1 and 3) surnamed “Larsson”. We cannot be sure that these two are related to each other as this is a common surname, but as they inhabit the same village it is quite likely.
   After the names comes the land owning nature of the homestead, such as “krono”, “skattekrono”, “frälse” etc. If the land is “frälse” (owned by a noble) sometimes the name of the nobleman/woman or the estate is noted.
   The third thing described is the value of the farmers’ land in the unit “öresland”. Öresland is a unit that does not necessarily describe the amount of land; it can also be a description of the revenues. The exact meaning of this unit seems somewhat uncertain depending on what area you are investigating. In Uppland, there seems to be a quite clear correlation between öresland and tunnland. In the YGK-project we are converting all land values into the same unit, called penningland (1 öresland is the same as 24 penningland) which is more common in this period. This is done in order to make the statistics from various areas comparable with each other.
   After this, the annual revenues of the homestead are described. Each homestead usually use the two field system and therefore the revenues are described for each year of farming.
   Under the revenues, you can sometimes find information on areas used by the farmer which lie outside the village (in Swedish “utjordar”), often in a neighbouring area. Sometimes the revenues for these patches of land can be found in the homesteads description, but most of times this is described in another map, if such exists. More on this below.
   Another thing to note here is something found above the description of the homesteads. We can usually find information here about the outfields (though it is not really fields) of the village. The outfields or the “outlands” (perhaps a better term) of a village are usually used for grazing, gathering of firewood, fishing and some hunting. Outlands are usually not described in detail, but the quality is defined by terms such as “good fishing” or “almost no firewood at all”. In this case we can read that the outland of Stjärnholm consists of bare ground which provides poor grazing.

Now we will investigate the homesteads:    

Homestead number 1: This is a ”skattekrono” homestead inhabited by Erich Larsson. The farmers’ land is worth 14 öresland (336 penningland). We can see that one year the revenues of the farmed field are 12 tunnor and 11, 19/87 cappor. Next year the revenues are 9 tunnor and 19, 3/87 cappor. The surveyor has calculated the mean value of the revenues from these two years and written down the result in the row to the right. To calculate the total area of the fields we simply have to multiply the mean value by 2 (as this is a two field system). The result is: 21.945 tunnland. The meadows bring in 15, 39/87 sommarlass of hay each year.
This farm also owns three patches of land in other areas. Specifically these areas are: “Wreeta”, “Fänsgiärde” and “Fittja parish”. If these areas are mapped or not we cannot at the moment know. All that can be said is that they do not exist in the same volume of maps (named A16).

Homestead number 2: This is a “frälse” homestead inhabited by Johan Mattzon. The farmers’ land is worth 14, ¾ öresland (354 penningland). The mean value of the revenues is: 11 tunnor and 17, 163/174 cappor. This means that the farmed fields are 23.121 tunnland. The meadows bring in 16, 24/87 sommarlass of hay each year.

Homestead number 3: This is a “frälse” homestead inhabited by Johan Larsson. The value, fields and meadows are the same as number 2. Here it is also noted that number 2 and 3 have common land in an area called “Fänsgärde”.


In short:

Homestead   Owning         Fields(tunnland)                 Meadows(lass)            Value(pen)
1                    skattekrono    21.945                                 15.448                           336
2                    frälse              23.121                                 16.275                           354
3                    frälse              23.121                                 16.275                           354


That was all for now. Hope you have enjoyed your visit to Stjärnholm village!

NOTE:
All maps taken from http://www.lantmateriet.se/

2013-04-26

A VISIT TO A 17th CENTURY VILLAGE part.1: Landowning and measurement units

   Though rectification and everything might be really interesting and useful, I thought today that I might talk a bit about the village economy of the 17th century. This is not only an interesting subject in itself, but also it gives you a better understanding of historical maps from this period. Also, the economy of the 17th century in many ways reflects more or less similar economies in at least the 16th and the 15th century.
We will now travel to the small village of Stjärnholm!

The location of Stjärnholm village, to the northwest of Stockholm. If you feel like visiting!


Present-day Stjärnholm, with the locations of the 17th century homesteads marked by red dots. The orange dot indicates a hop-yard, a quite vital part of historical villages which allowed the farmers to brew ale. The blue dots shows unchanged patterns in the landscape. For a change the road can be used as reference points as the junctions have remained the same from the 17th century till today. 


17th century map of Stjärnholm, made by surveyor Hans Barckhus in 1688


   The first evidence for a village here we find in documents from 1299, where we can find the name “Stiernholm”. Apparently the area have been occupied by farmland for some while when we start our investigation, but it is quite unclear how large the village have been in previous centuries.

The map description, called "Notarum explicatio"


In the document accompanying the map we can see that the village in the 17th century consists of “3 hemman” (marked by the top red ring) which means “3 homesteads”. This tells us nothing really of the number of buildings, as the map might indicate, but should rather be considered as the number of farming, landowning units. The nature of landowning might be different from homestead to homestead. In this village, homestead number 2 and 3 are “frälse” (“noble”) and cultivating land owned by some local nobleman (in a place called “Siöö”) while number 1 is a more special case. This homestead is labelled as “skattekrono” (“taxcrown”, sort of) which means that the land is owned by the farmer himself but he owes interest to the crown. The phenomenon of both noble and royally controlled land in the same village is quite common. How this affected the farmers and their internal relationships is not known and can be discussed.

   The next thing to note is the capital letters beneath the red ring (marked by the purple ring). This is a description of the fields and meadows found in the map. Usually it describes the nature of the soil (mud, sand, full of rocks, forest etc.), the size of the area and the annual revenues. Fields were usually farmed in what in Swedish is called “tvåsädesbruk” (two field system) which means that the crops were rotated between two main fields. In this case, the field labelled A was cultivated one year, and B the next year. The small field labelled “C” in the bottom of the map was cultivated annually. In the eastern part of Sweden, the two field system was the most common system of crop rotation until more modern ways of cultivation replaced older ones.
   Units of measurement in the 17th century were quite different from ours, apparently. The columns marked by the red and the green rings are evidence for this. In the green ring are stated the revenues of each field, measured in tunnor and cappor. Tunnor means “barrels” and 1 “tunna” is the same as the amount of grain gained from 1 “tunnland”. In English “tunnland” is called “acre”, though one acre is 4 047 m² and one tunnland is 4937 m². Cappor instead is a subunit of tunnor where 32 cappor (or “kappland”) is the equivalent of 1 tunna.
The meadows are measured in sommarlass, which means “summer load” sort of. 1 sommarlass is the same as 213 kilograms of hay. In this case we can see that the village in total has a revenue of 48 sommarlass annually, which equals 10224 kilograms!
Also, these units can vary a lot from area to area. In Uppland for an example, fields are sometimes measured in fjärding which is another subunit of tunnor.

That was all for now, I will continue my visit to Stjärnholm village in later posts!   NOTE:All maps taken from http://www.lantmateriet.se/


2013-04-17

Rectification results!

Here are some results from a rectification I just did, using the methodology described in the last post. The map in the last post did not give a good result, as it was heavily distorted by the surveyor whom I now actively distrust. ;-)
But the map in the last post illustrates some of the key problems in rectificating these old geometrical maps. As a result of their instruments and methods, the surveyors only had limited possibilities to cover a whole area, escpecially from one position. The surveyor had to change position (from where he was measuring and triangulating) several times during his work. Features of real importance were usually measured from a close distance and this is why the maps are more accurate inside the actual boundaries (in swediish called "hängnad") of the farming lands. Outside these boundaries the maps are sometimes quite distorted or innaccurate, so caution must be observed. Furthermore, some surveyors were apparently MUCH more accurate than others. A man named Jacob Braun, whose maps I am currently quite engaged with, appears to have made a good effort in making accurate measurements over long distances.
What does this mean for we who are rectifying? This means that even if we identify key common features in the map, it might sometimes be so heavily distorted (especially in the edges) that a good rectification is almost impossible. The people I'm working with are somewhat more up to date on this matter, so I'll be giving you more information on how to confront this problem in the near future.

Here is another case study, with one of Jacob Braun's maps. :) The result proved quite good, considering that is almost only just an overlay and the map is really old.


A map of Hässle manor in Fittja parish, Uppland. Done by Jacob Braun in 1690.


A modern day topographical map of the same area. The features in the map have all been added manually by measuring and triangulating in the old map. Only three georeference points were added, marked by the smaller red dots.


The rectified result, sorry for the bad quality. The transformation type I used is called Helmert, and basically only scales and rotates your picture. You can see almost all the marked features smoothly aligning with the historical map, with just a slight distortion. Most of the topography fits surprisingly well, as well. 


That was all for now, stay tuned for more on this exciting subject!
 
 
NOTE:
All maps taken from http://www.lantmateriet.se/

2013-04-15

On Historical Maps and Rectification


The rectification of historical maps is a commonly used tool for understanding landscapes and archaeological sites. It is often used by contract archaeology to determine the location of potentially interesting features. By landscape archaeologists rectification is used to make landscape analysis in order to recognize certain changes. But while this tool is effective and easy to use in most GIS softwares it is by many geographers considered to shallow and inaccurate. The rectification often stretches the original map to a point were the historical surveyors’ measurements are no longer valid. It is true that historical maps may be inaccurate, but most of times they are surprisingly well made, as discussed below. Therefore it should be considered whether stretching of original maps is a good way to work or not. The accuracy of the surveyor must always be taken into account. Also, rectification does not often promote an actual understanding of the map, it merely tries to force common points without too much thought. I have chosen to take the perspective of the geographer in this, and the method described below shows another good way of working with historical maps and in turn rectification. Most of this is based on the methodology of the project I’m currently working on dealing with 17th century maps from Sweden. If you want to know more please visit http://www.riksarkivet.se/default.aspx?id=21561&refid=22519 or send me an email!

   First we must recognize the parts of the map that have not changed for 300 years or so. Many times roads are used for rectification of historical maps, but these are in my opinion quite uncertain elements and it is possible that they have changed a lot during the centuries. This also applies for humanly created features like farmsteads, bridges and sometimes also large manors and churches. The only humanly created feature that can be used as points of rectification with a quite good accuracy are the administrative borders found in historical maps. These are quite surprisingly often still used today and although some changes have been made it is usually not a very hard task to recognize parts that are unchanged. Otherwise, it is usually the natural topography that gives us a hint of common points. Mountains and rocky parts of land were usually not cultivated in the 17th century, and are commonly still not cultivated today. In the map of Hammarby, we can see such a large patch of land just northwest of the village itself. Also, to the direct southeast of the village there is a perhaps more useful round patch in the farming fields (marked by green ring, bottom left corner of present day map). Just south of the label Backgården there is another fairly certain point (marked by the blue ring).


A 17th century map of Hammarby in Uppsala county. The village is at least medieval and fairly large, though its exact origin remains quite uncertain.


A modern day economic map of the same area. The positions of the farmsteads in the historical map are marked with red points

   It is surprising how accurate the some 17th century Swedish surveyors actually were. It is usually said that they were the most accurate with the actual fields and within the boundaries of the farmsteads, but in measuring in the actual map itself it is proved that their abilities went far beyond that. Of course, this depended on the surveyor himself, as some were much more accurate and detailed than others.
As a result of this relatively high accuracy it is usually possible to use the scale bar (marked with a red ring in the picture) found in the historical map itself to make measurements. In the 17th century maps of Sweden, the units are measured in “alnar”. 1 “aln” is the same as 59.3 centimetres and a good way to start is by converting the scale bar into modern units. This can be done easily with the program DjVu viewer (http://www.djvuviewer.com/) if your file is in djvu format. Otherwise, though perhaps more complicated, you can probably reach the same result using your GIS software or CAD. In doing this you can calculate the relative accuracy of your particular surveyor by measuring distances between topographical features and boundaries, both in the historical and the present-day map.

   After this procedure you can use the common points in topography and administration described above to triangulate the position of features of interest in the historical map. Usually it is enough to take two measurements in the historical map, from the common point in the landscape to the feature. When these two measurements correlate from the same points in the present-day map you are usually quite close to your feature.

   To give support to the position of your features it is usually a good thing to consult your country’s record of monuments and sites. In Sweden, the online database called FMIS is a good resource for validating your results. Also, as it is always good to use multiple sources, you should also consult more recent historical maps. In the case of Hammarby I used an economic map from the 19th and early 20th centuries called “Häradskartan” were some of the old features still remain. Fields and topography are also more easily recognized. These historical yet quite recent maps are usually considered a bridging point between older and present day maps.

How these points can be used in making a rectification must still await a complete evaluation, but they should at least provide more valid information on the position of the mapped features. In this particular map, for an instance, I have only put a few points in the centre, which would not be a good base for rectification of the complete map. This is rather another way of recognizing common features in the maps. In order to make a good rectification I would need to use the whole of the quite extensive map, which is not possible at the moment, sadly. I will come back with a rectification result when I have gathered enough data to do so. Until then, I hope that my geographers perspective have proved inspiring!

NOTE:
All maps taken from http://www.lantmateriet.se/
2013-04-07

Work placement at the national archives

WORK PLACEMENT AT THE NATIONAL ARCHIVES
 
 
This week I started my work placement at the national archives in Stockholm, Sweden. I am currently working as a trainee in a project called “Yngre geometriska kartor” (Younger geometrical maps). We are working with the digitalization of Swedish maps dating from the 17th century, putting coordinates on features found in the maps (like houses, mills, barns, bridges etcetc.) and making statistics of the mainly economical information found in the map descriptions. All the maps and the connected information are made publicly available through an online database called GEORG. For anyone interested in the historical geography of Sweden this provides a wealth of information previously rather unavailable. The landscape found in this maps have much older origins than the 17th century and conclusions about for an example medieval landscapes can be drawn from them. This is extremely exciting and I will keep you updated on the progress of our work this spring.


A map of Österby manor in Uppland from 1688 by a quite good cartographer named Petter Arosander, which I had the oppurtunity to register this week. The manor itself seems to have been replaced by a more modern one in later centuries though the foundations must still remain. The location of the church ("Ålands kyrka") in the northwest corner of the map remains intact. This was founded in the 15th century. The church village represented by the lonely house (the rest of the older village is located just west of the river) close to the bridge have even older origins and the name Åland can be traced to the 13th century.

Here’s a link to the now finished project about the “Older geometrical maps” which maps dates to the start of the 17th century. The material is already available for the keen researcher to use. Basic knowledge in Swedish is required, however.